Under constructionStatus: Building. Being built now. Parts may run; the whole is not finished.
Every project’s status →01.09Task graph viewer
Vox Canvas: a browser task graph viewer
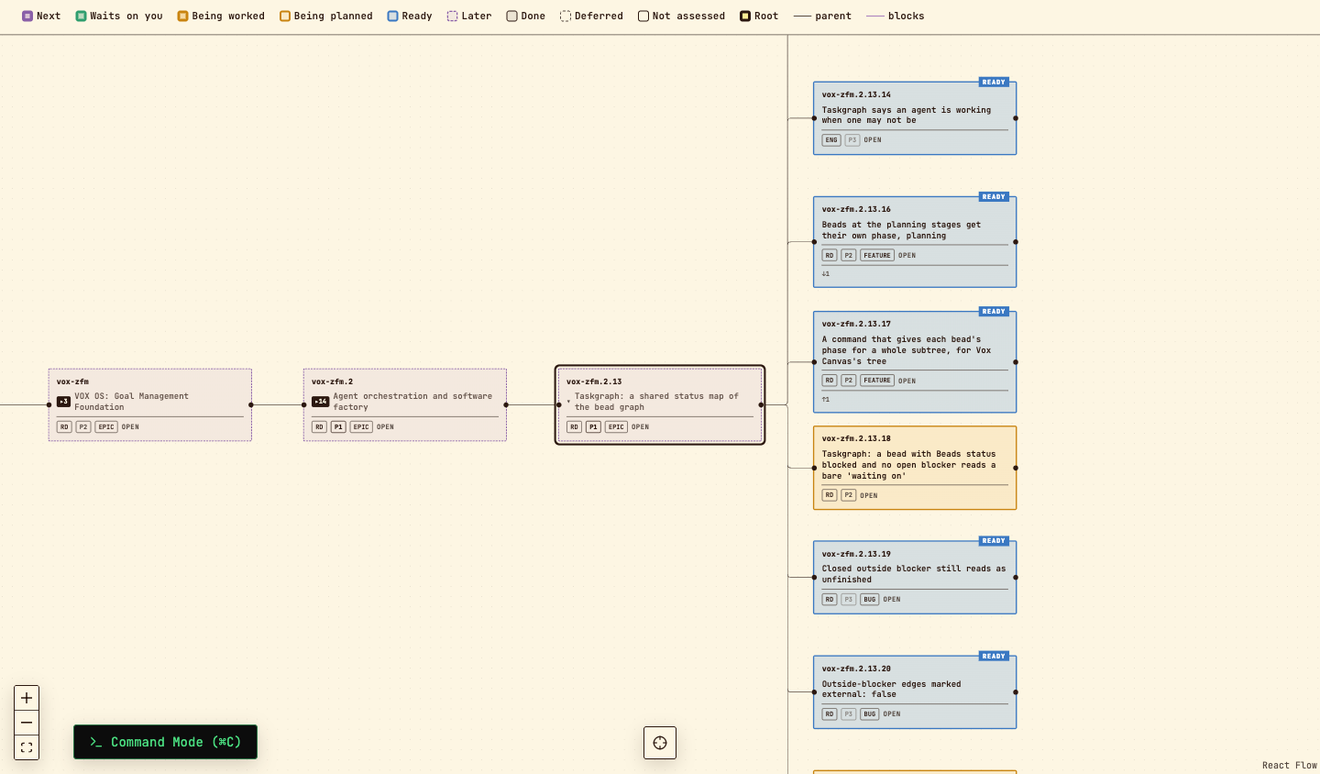
Vox Canvas is AR Labs' keyboard-driven browser canvas for its task graph: a tree to move through, a panel for each task, and Taskgraph's status map in place.
On this page
Vox Canvas is a browser application, built by AR Labs, for moving around our task graph (all tracked tasks and the dependencies between them) with the keyboard. It draws the tasks as a tree on a canvas you can pan and zoom, opens any task in a side panel, and switches in place to a status map of one branch drawn by Taskgraph. It reads live tasks from Beads, Steve Yegge's open-source issue tracker for coding agents, and runs on the machine that holds them. It is the browser part of VOX OS, our design for an operating layer over the work of AI agents (language models run in a loop with tools).
What it is for
In Beads each task is a bead: an issue with a parent, children, a status and dependency edges to other beads. Our beads form one tree of goals, projects and tasks, several hundred of them. Taskgraph draws one branch at a time as a static page, and VOX Torch shows the same answers in a terminal. Canvas is for moving across the whole tree: find a branch, see its shape, open a task, follow a dependency to its neighbour, fix a title, and step back out without losing your place.
Moving around a large tree
The tree runs left to right, parent to children, as cards coloured by each task's state. Focus mode (f) is the main tool for size: it hides everything except the selected task's ancestors and its whole subtree, so a branch of thirty tasks can be read without the other four hundred. Closed work is hidden by default and a brings it back.
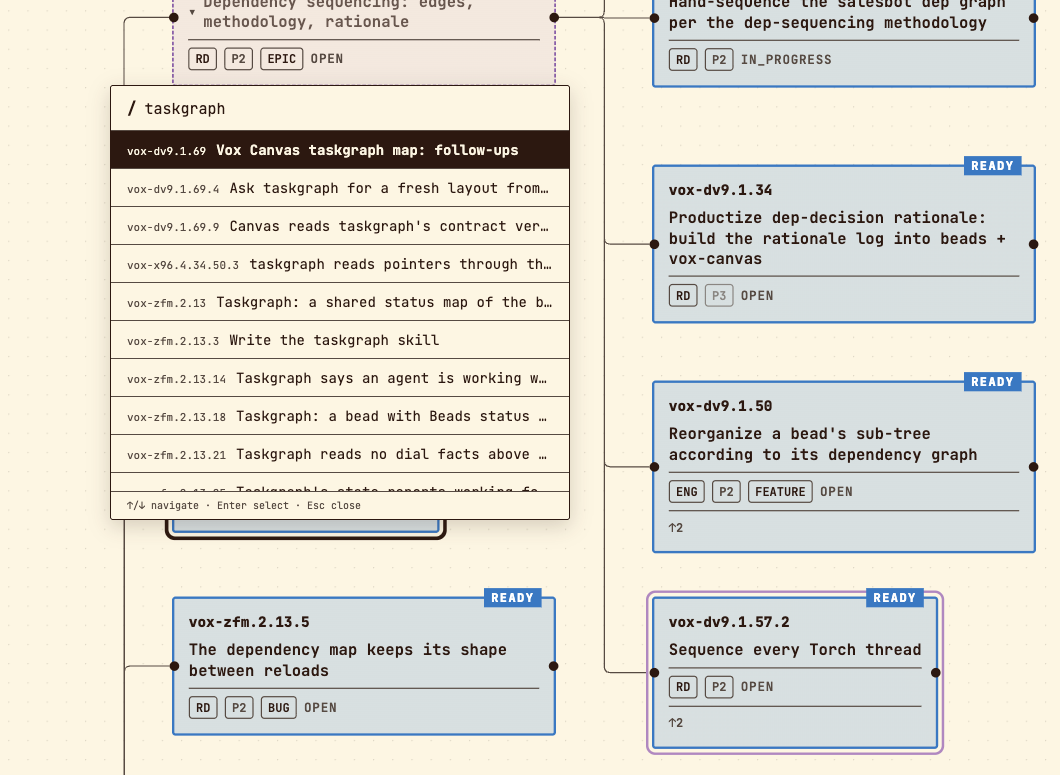
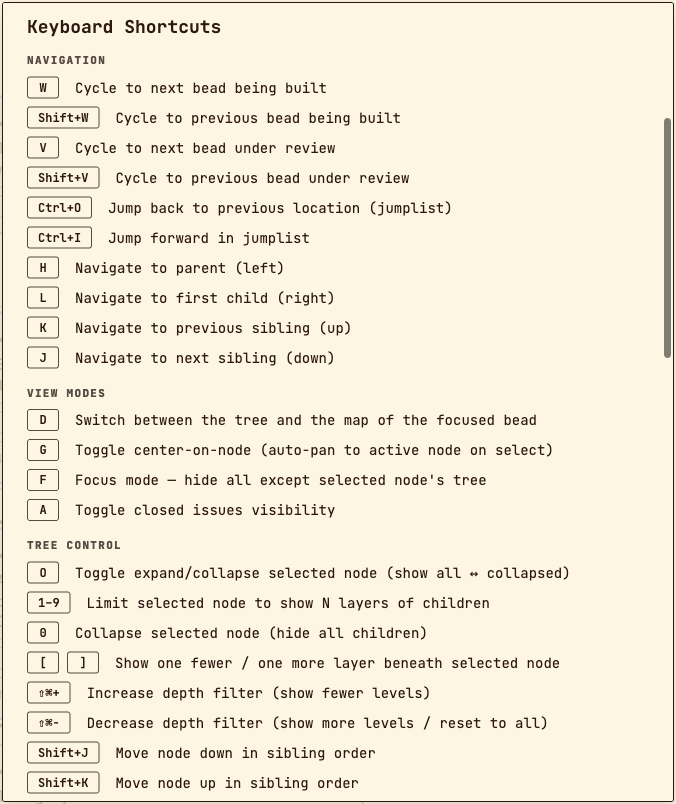
Depth is set per task as well as for the whole view. 1 to 9 show that many layers beneath the selected card, 0 collapses it, and [ and ] show one layer fewer or more; a card with hidden children shows how many. / opens a search over titles and IDs, and choosing a result clears only the filters that were hiding it. Every jump is recorded, so Ctrl-O and Ctrl-I step back and forward through where you have been, as in the vim editor.
Selection, focus and the keyboard
There is one selection at a time, drawn as a dark ring. h moves to the parent, l to the first child, j and k to the next and previous sibling. With follow mode on (g) the camera pans to each new selection; Enter switches between a close view of the selected card and the whole tree. w and v cycle through the tasks currently being built and the tasks under review, so work in progress can be found without searching for it.
? opens a help dialog generated from the same tables the keys are bound from, so it cannot drift from what the keys do. A click also selects, scroll zooms and Shift with scroll pans.
What opening a task shows
The side panel (Tab shows or hides it) loads the whole bead each time the selection changes: status, priority and type, description, the tasks it depends on and blocks, acceptance criteria, design and notes, links to its spec and pull request, and its metadata, which includes its stage in our coding pipeline (the route every code change takes: spec, test-first build, second-model review, a person's merge). Each dependency is a link: clicking it selects that task. On the canvas, the beads joined to the selection by a blocking edge get a thinner coloured ring, so cross-branch dependencies show only when they are relevant.
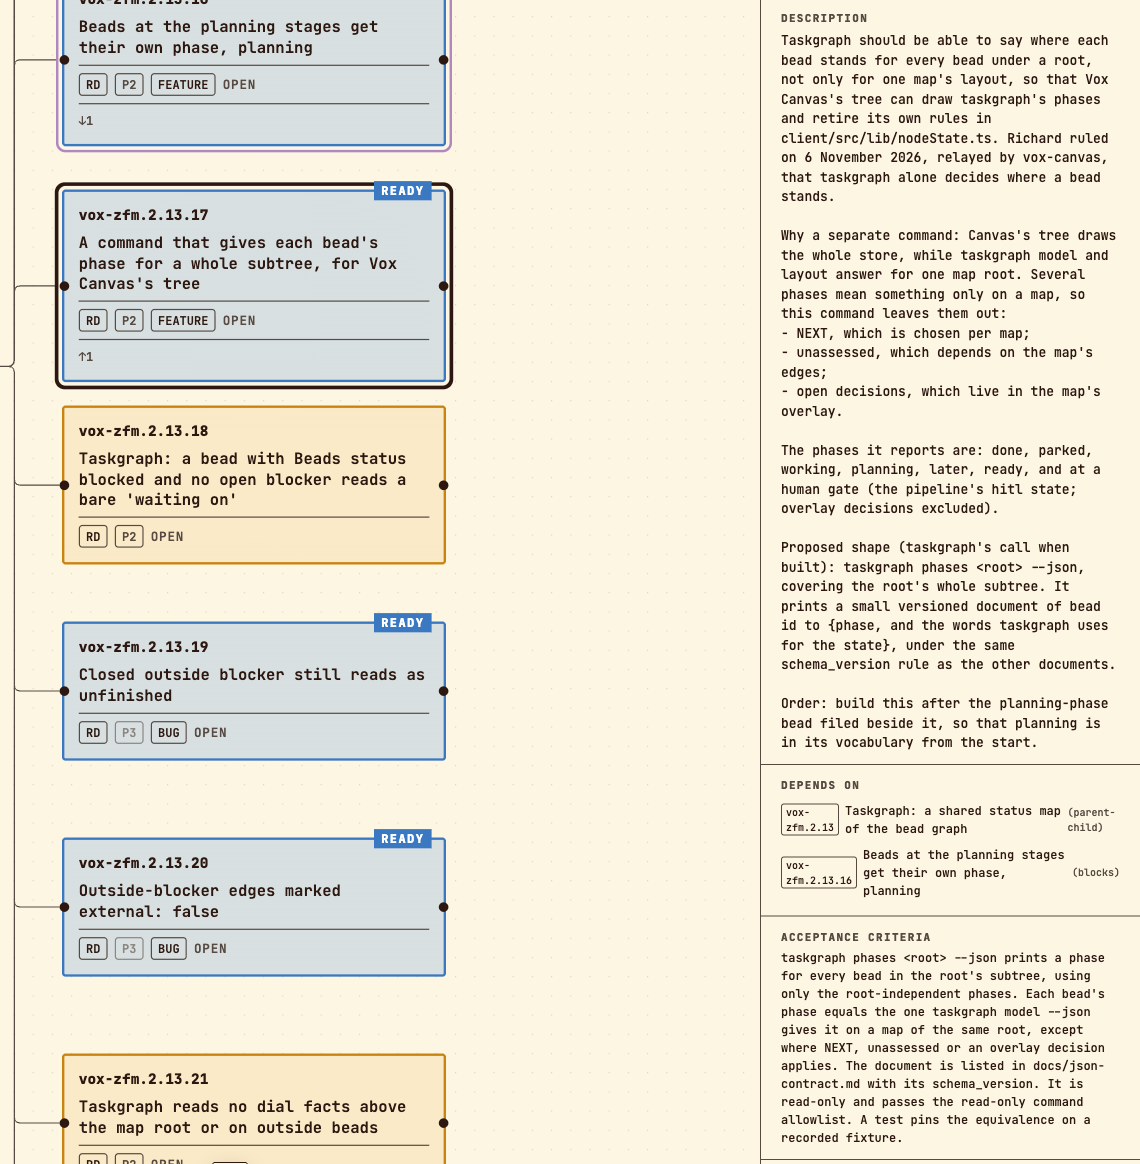
Title, description and notes are edited in the panel; a save shows at once and is undone with a message if Beads refuses it. i opens a status picker. s opens the task's spec file and p its pull request, and m closes a task whose pull request has merged.
How status is shown
Each card's fill and border are its phase in Taskgraph's palette: NEXT, waiting on you, being worked, being planned, ready, later, done, deferred and not assessed, the same colours as Taskgraph's own maps. A slow pulse marks a card that is being worked or waiting on a person. Light and dark themes follow the system, and t overrides it.
On the map, every phase comes from Taskgraph. The tree still uses Canvas's own rules from status, pipeline stage and the children's state, mapped onto the same looks, until Taskgraph adds a command that reports a phase for every bead under a root.
The map inside Canvas
With a task focused, d turns the canvas into Taskgraph's map of that branch, and d again returns to the tree with the same task selected. The server runs Taskgraph's layout command and Canvas draws exactly what its JSON says, with a strip beneath for where the work stands, what happens in order, decisions waiting for a person, and beads nobody has sequenced. In map mode the direction keys move across columns and between lanes, and n jumps to the step marked NEXT.
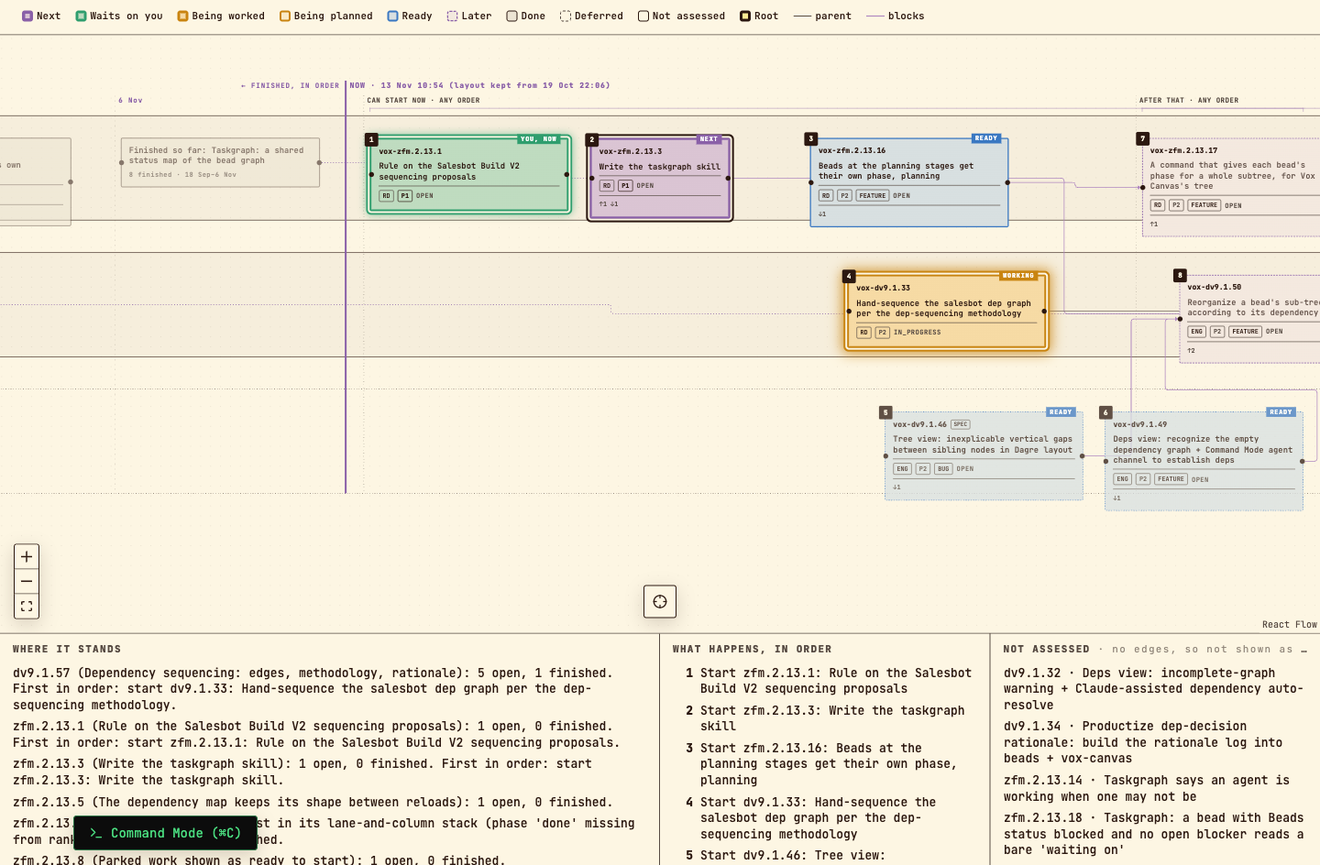
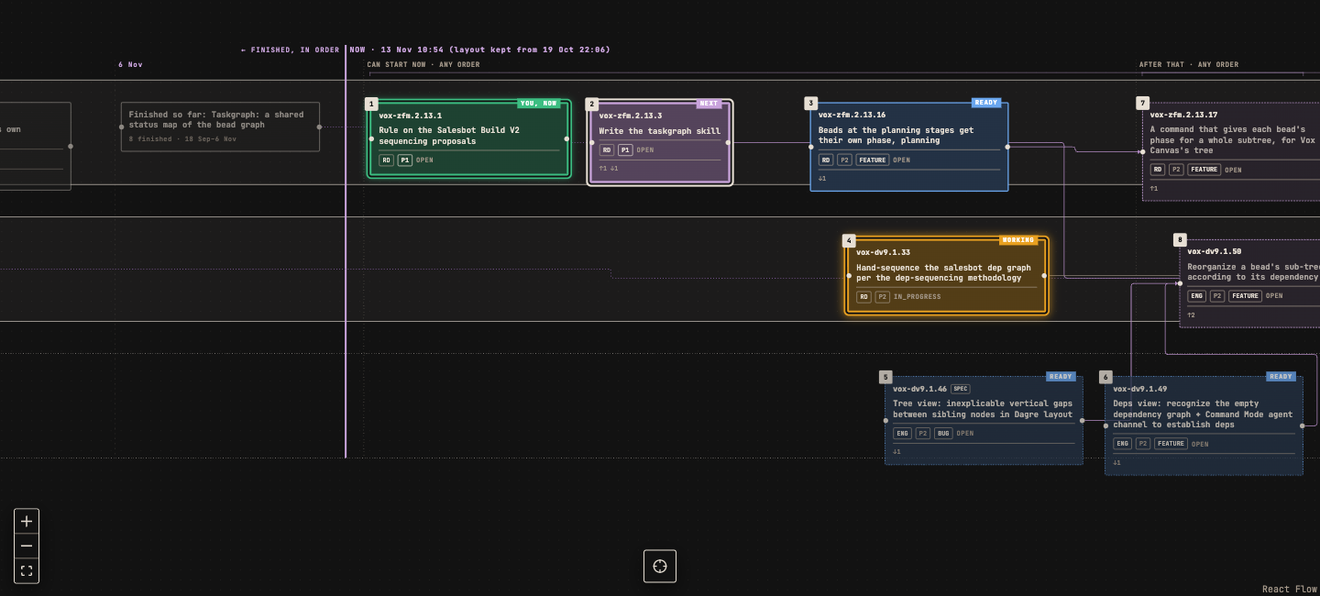
If Taskgraph cannot answer, Canvas names the reason (for example not installed, timed out, unreadable output, or a contract version it does not know) and how to get back to the tree, instead of showing an empty map.
Staying in step with the data
Canvas reloads when asked (r), when a mode is entered and after its own writes; it does not poll or watch files. Its decision record gives the reason: a single user knows when the data has changed, and a viewer with no background timers costs nothing while open, at the price of a badge that can be stale until the next refresh. The map is never cached.
Decisions and what they replaced
- A viewer with an editing panel. The canvas never re-parents tasks; structure stays with the agents and people who own the graph.
- Dependencies on demand. Even five to ten crossing edges make a left-to-right tree hard to read, so cross-branch dependencies show when a task is selected rather than all the time.
- The dependency view, twice replaced. The first version re-ranked the tree in place by dependency order. Testing it in a browser showed three faults: one horizontal axis meant both "is part of" and "must come before", it ignored focus and drew the whole store, and the second mode bred bugs across the canvas code. A dedicated page with its own rank-column layout followed. Both were replaced by Taskgraph's map, drawn as a second layout of one shared canvas engine, which answers all three faults.
- One colour per task. For a time the map coloured a card by Canvas's own state and showed Taskgraph's phase as a chip, so one task could appear in two colours. Canvas now wears Taskgraph's whole look, and the fill is the phase.
- Never write pipeline state. Canvas shows a task's pipeline stage but never edits it.
What exists today
Built and in use against live data: the tree with focus, depth, search, the jumplist and panel editing; map mode with Taskgraph's maps; light and dark themes; and a sessions mode that lists the Claude Code sessions running on the machine, each with a status badge. Designed and not built: resuming or starting an agent session from the canvas, transcript previews, saved views in a sidebar, and creating a task from the canvas, whose key draws a placeholder card that is not yet saved. The Voice button is reserved for a later spoken interface and does nothing yet. Canvas is a desktop tool with no layout for phone screens, it is local-only with no sign-in, and its source is not yet public.
How it was built
flowchart LR
  U["Browser: tree, map, sessions"]
  S["Express server"]
  BD["bd command-line tool"]
  B[("Beads task graph")]
  TG["Taskgraph layout JSON"]
  CR["Claude Code session records"]
  U -->|"HTTP /api"| S
  S --> BD --> B
  S --> TG --> B
  S --> CR
The client is TypeScript with React 18, React Flow, Zustand and Dagre. A small Express server reads and writes Beads by running the bd command-line tool, so Canvas depends only on Beads' published interface. One canvas engine holds the camera, zoom, panel, refresh and shared keys, and each mode is a layout provider that supplies positions and its own extra keys; a test keeps the engine from branching on which layout it holds. A contract test keeps Canvas's copy of Taskgraph's JSON types identical to Taskgraph's published contract, and another forbids colour values outside the shared palette. The project records its decisions as architecture decision records, 42 of them so far.
Referenced by 12
- ProjectsVOX OS: personal AI operating system architecturelinks here in its text
- ProjectsVOX Torch: a terminal view over AI agent worklinks here in its text
- ProjectsTaskgraph: a status map for coding agent worklinks here in its text
- ProjectsGoal Map / Agent Orchestrator: AI agent sessions around the month's goallinks here in its text
- ProjectsAI software factory: coding agents with gateslinks here in its text
- ConceptsThe future of work with AI agentslinks here in its text
- ConceptsThe Loop: how AR Labs workslinks here in its text
- ConceptsThe AI interface architectlinks here in its text
- ConceptsVOX: voice in, concepts outlinks here in its text
- ConceptsThe intelligence is in the orderinglinks here in its text
- ResearchDisplaying a task dependency graph so one person sees what to do nextlists this as related
- ResearchNode-graph and infinite-canvas tools for a human and AI agent task graphlinks here in its text