Under constructionStatus: Building. Being built now. Parts may run; the whole is not finished.
Every project’s status →01.12Work status model
Taskgraph: a status map for coding agent work
Taskgraph is AR Labs' command-line tool that reads a branch of the task graph with its git and pipeline state and maps where the work stands.
Taskgraph is a command-line tool, built by AR Labs, that reads one branch of our task graph (all tracked tasks and the dependencies between them), together with the git history and coding-pipeline state behind it, and explains where that piece of work stands: what is finished and where its code landed, what is in flight, what happens next and in what order, and every point where work waits for a person. It prints that explanation as versioned JSON and can draw it as a map. It is the shared status model behind our terminal and browser views of AI agent work, VOX Torch and Vox Canvas, and it exists so that a person and the agent orchestrating the work can agree, from one picture, on what happens next. An AI agent here is a language model run in a loop with tools, so it can act as well as reply.
What it shows
We track work in Beads, Steve Yegge's open-source issue tracker for coding agents. Each tracked task is a bead; beads form a tree of parents and children with dependency edges. Our coding pipeline, the route every code change takes (spec, test-first build, second-model review, a person's merge), records each bead's position in that route as bead metadata. A campaign is work planned in one PRP (product requirement prompt, a plan agents build from) and split into a tree of tasks under a parent bead, which the coding pipeline works through as one effort, landing on a shared branch before it is merged. A Taskgraph map shows one parent bead, the root, and everything under it.
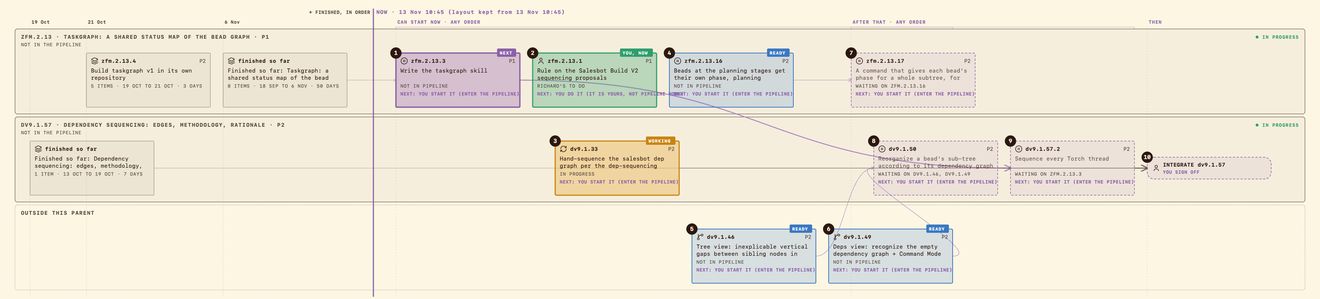
The default view is a timeline. A vertical NOW line divides the page: finished work sits to its left in order of completion, each card stamped with where its code landed; remaining work sits to its right, one numbered step per column, so reading left to right is reading the recommended order. Steps that could be done in either order are bracketed as "any order". One lane per parent is ordered by when its next step comes. Above the lanes, a git-style track shows the main branch and each campaign's integration branch, how far ahead it is, and whether its worktrees (separate checkouts of the repository, one per task) hold uncommitted work.
Beside the map are two lists: the steps that will happen, in order, and the decisions waiting for a person, each saying which step it affects. Keeping them separate stops decisions being counted as steps.
Reading a map
The pictures on this page are Taskgraph's own output, drawn on 13 November 2026 from the branch of our task graph that holds Taskgraph's own work: its bugs, its features and the sequencing method it draws. Every card is one bead, with its ID, title, priority and the next thing that has to happen to it.
The legend at the top of every map sets out the colour of each phase and the meaning of each line. Purple is NEXT, the one step to do first; green is waiting on a person now; amber is being worked now; blue is ready to start; a dashed outline is later, still blocked; grey is finished. A solid line is a dependency recorded in Beads, a dashed line is a proposed one waiting for approval, and a dotted outline marks a bead that lives outside the parent being mapped.

Left of the NOW line, finished work is folded into "finished so far" cards that count the items and give the span of dates, so a long history does not push the remaining work off the page. Each lane is headed by its parent and that parent's place in the coding pipeline. Right of the line, the first column is headed "can start now, any order", and its first card carries the NEXT tag and the action that starts it.
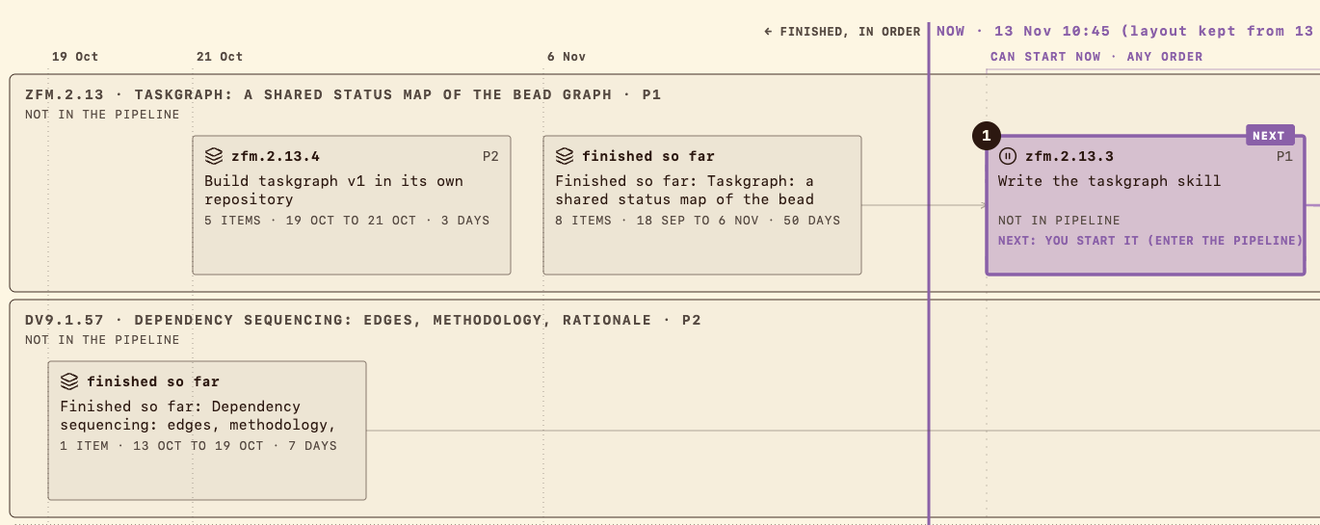
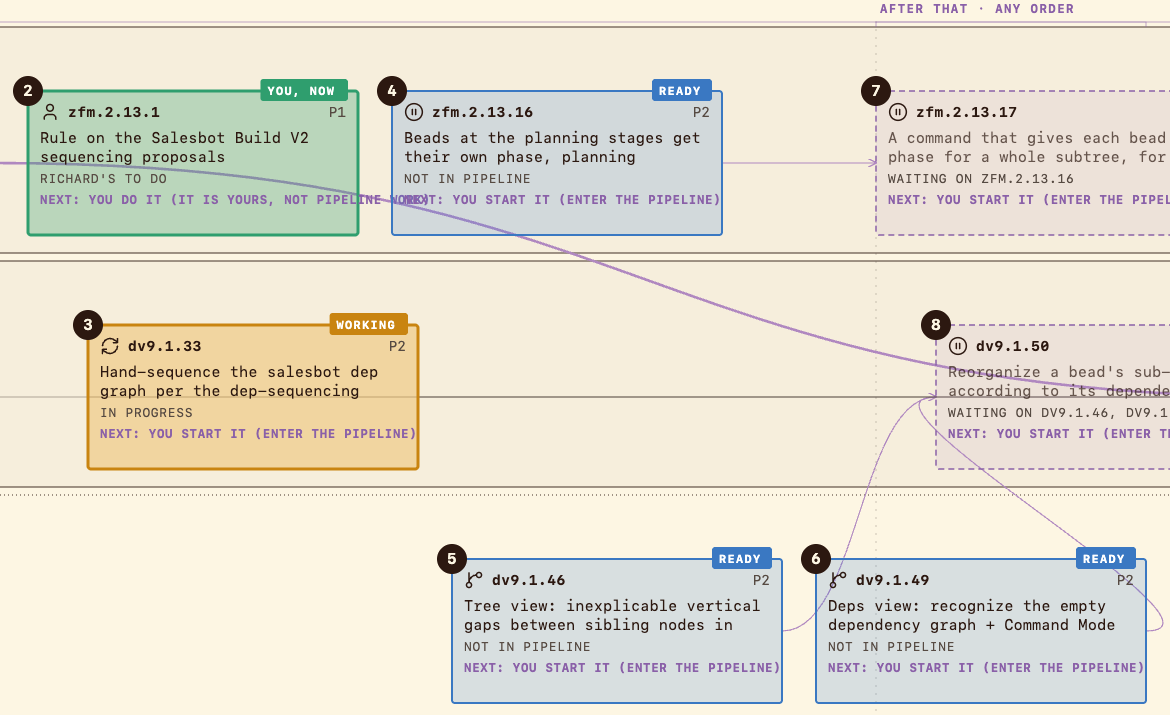
Further right, the phases sit side by side in recommended order. Step 2 is green because it waits on a person: its card reads "Richard's to do", and its next action is one only a person can take, outside the pipeline. Step 3 is amber because it is in progress, and steps 5 and 6 are ready but belong to another parent, so they sit in the band below, still numbered in the same order. Steps 7 and 8 are dashed: each card names the step it is waiting on, and the line from its blocker shows where that wait comes from.
Below the lanes, a separate band lists beads with no dependency edge in either direction. They are not drawn as ready, because nobody has yet decided what they depend on.

How it works
flowchart LR
  B[("Beads")]
  G["git and GitHub"]
  MF["Pipeline manifest"]
  OV["Overlay of proposals"]
  MO["Model"]
  LA["Logical layout"]
  SV["SVG and HTML page"]
  TO["VOX Torch kanban"]
  CA["Vox Canvas map mode"]
  B --> MO
  G --> MO
  MF --> MO
  OV --> MO
  MO --> LA
  LA --> SV
  LA --> TO
  LA --> CA
Taskgraph is built in three layers that meet only through JSON:
- Model. Reads every source and produces one document with no positions or colours: each item's phase (finished, being worked, being planned, waiting on a person, ready, next, later, not assessed, outside this parent), its remaining human stops, where it landed, and the ordered list of actions.
- Logical layout. Assigns each item a lane, a column and an order, still with no pixels or characters.
- Renderers. Turn the layout into one medium. The SVG renderer with a pan-and-zoom HTML viewer is built into Taskgraph; VOX Torch and Vox Canvas render the same JSON in the terminal and the browser.
A command-line tool printing JSON is also the boundary between consumers written in different languages: Torch is Python and Canvas is TypeScript, and neither imports the other's code. The JSON is a public contract with a schema_version that changes only for a breaking change.
The diagram above opens Taskgraph itself; the figure below shows it from outside, among the views that use it. Taskgraph works out the state once, and VOX Torch, Vox Canvas and its own SVG map draw that one answer, while Torch and Canvas also read Beads and the records of agent sessions directly. The goal map, drawn beside them, does not read the task graph at all: it is built from a sweep of agent sessions.
Some of the rules the model applies:
- NEXT, the single step the map recommends doing first, is the ready item heading the longest remaining chain of work. An item held by a proposed dependency nobody has decided is not ready.
- Assessment comes before the map. A bead with no dependency edge in either direction, and no label saying it is independent, is "not assessed" and is never shown as ready. That list is the to-do list for a sequencing pass, in which a person decides each bead's dependencies.
- Pipeline steps that are not beads are drawn. Each parent gets an integration step, and a campaign gets its final merge and clean-up, so the human stops that the pipeline implies appear on the map.
- Structure is stable. The layout is kept between runs; when work finishes, only its colour and status change, in place. A fresh layout is drawn only on request.
- Every derived fact names its basis.
Taskgraph only reads. It runs bd, git and gh with read-only commands and never writes a bead or an edge. Proposed dependency edges live in a per-map overlay file; they are written into Beads through a separate sequencing procedure after a person approves them, so drawing the map never changes the graph it reports on.
How it was built
Taskgraph began as a single prototype script of about 1,600 lines that read every source and drew the page in one pass. It replaced hand-drawn maps of constellations (sets of related beads that cut across the tree, grouped under one anchor bead), which went stale because they never read Beads. Once the prototype's rules had been shaped against live data, they were written into a design document and a first release was built as a tested package in its own repository, in Python with no runtime dependencies beyond the tools it reads through.
The first release had to prove it drew the same pages as the prototype from the same inputs. A recording of everything the prototype read for a root was made once; both tools replayed it, and their outputs were compared. The test suite runs offline on recorded data with strict replay, which fails naming any call the recording lacks, and compares the model, layout and pages with stored golden files. A live check against current data is available and off by default, and it works on temporary copies so it never changes our files.
What exists today
The first release is built, tested and merged in a private repository, and continues to receive fixes. VOX Torch draws each thread's kanban from its JSON, and Vox Canvas draws its map mode from it. The Taskgraph skill, the packaged instructions agents load to draw and refresh maps, still runs the prototype until a follow-up switches it over. Not yet decided: a permanent home for proposed edges and decisions in place of the overlay file, and incremental layout for live updates.
Referenced by 13
- ProjectsVOX OS: personal AI operating system architecturelinks here in its text
- ProjectsVox Canvas: a browser task graph viewerlinks here in its text
- ProjectsVOX Torch: a terminal view over AI agent worklinks here in its text
- ProjectsGoal Map / Agent Orchestrator: AI agent sessions around the month's goallinks here in its text
- ProjectsAI software factory: coding agents with gateslinks here in its text
- ProjectsCoding Planner: a spec-driven workflow for Claude Codelists this as related
- ConceptsThe Loop: how AR Labs workslinks here in its text
- ConceptsThe intelligence is in the orderinglinks here in its text
- SkillsGrill Me: Claude Code skill for design interviewslinks here in its text
- SkillsTaskgraph: Claude Code skill for AI agent status mapslinks here in its text
- SkillsPaper-and-ink theme: Claude Code skill for design tokenslinks here in its text
- ResearchDisplaying a task dependency graph so one person sees what to do nextlinks here in its text
- ResearchScheduling a task dependency graph across AI coding agentslinks here in its text